Last Friday’s release of the Q3 Quarterly National Accounts contained some interesting figures but the standout one was the 20% drop in Investment that occurred in the quarter. Investment is now down more than two thirds on its peak and is the main reason for the fall in the Irish economy over the past four years.
In fact, if we do an unusual dichotomy for the national accounts and break it into expenditure on “Goods and Services” and expenditure on “Capital Formation” we see that the former has held up while the latter is down nearly 70%.
The distinction is a little crude but “Goods and Services” is made up of C + G + NX:
- C – Personal Consumption of Goods and Services
- G – Net Expenditure by Central and Local Government on Current Goods and Services
- NX – Net Exports of Goods and Service (Exports minus Imports)
In the third quarter of 2007 these summed to:
€22.8 billion + €7.5 billion + (€37.9 billion – €33.4 billion) = €34.7 billion
The most recent figures for the third quarter of 2011 the figures were:
€20.0 billion + €6.4 billion + (€40.5 billion - €29.7 billion) = €37.3 billion
There have been reductions in expenditure by households (-12%) and government (-15%) but these have been offset by an increase in net exports (+70%). For the period 2007 to 2009 this was as a result of falling imports rather than rising exports but for the past 18 months or so the improvement in net exports has been as a result of increased demand abroad for goods and services produced in Ireland. Overall demand for goods and services is up €2.6 billion over the four years.
“Capital Formation” is just I from the National Accounts: Gross Domestic Fixed Capital Formation. Over the period used above quarterly investment fell €5.6 billion from €9.1 billion to €3.5 billion.
Quarterly GDP fell 7.6% from €43.5 billion in the third quarter of 2007 to €40.2 billion in the third quarter of 2011. Using the dichotomy we have applied here this is largely explained by the collapse in capital expenditure. To explore further the nature of the fall in investment see this post on patterns of investment over on irisheconomy.ie. The general idea is fairly clear - it is mainly a story of households and housing.
Two weeks ago the CSO released the 2010 update of the Estimates of the Capital Stock of Fixed Assets. Here is a graph of the value of the stock of fixed capital (excluding land) in 2009 prices.
The capital stock increased consistently from 1995 to 2008 and this is true for the overall capital stock and the capital stock excluding dwellings (other buildings, roads, transport equipment, other machinery and equipment, cultivated assets, computer software).
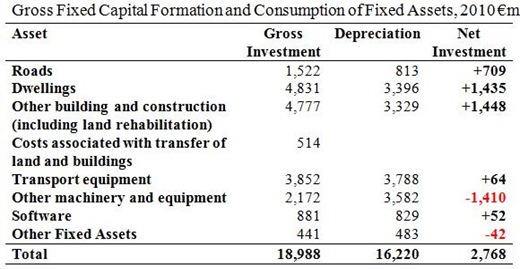
Of course, it is not that there was no investment in 2009 and 2010. There was €25.3 billion of gross capital formation in 2009 and €19.0 billion in 2010, but this was just enough to cover the amount the consumption of the existing stock of fixed capital (depreciation) so the increase in the net capital stock was much less.
[The investment figure here is form the National Income and Expenditure Accounts and the depreciation figure is from the Estimates of the Capital Stock of Fixed Assets. There may be some non-overlapping between the definition of fixed capital/assets used in each but it is unlikely to change the overall conclusion.]
The fall in investment has continued and in real terms 2011 is 15% behind 2010 so it is clear that investment this year will not be sufficient to cover depreciation. For the first time since the series began the real value of the capital stock in Ireland will fall. The picture is equally bleak if we exclude dwellings (with land excluded in all of the analysis here).
For most categories investment in 2010 exceeded the level of depreciation estimated by the CSO, but the gap has gotten substantially narrower and for 2011 will be negative in many cases.
The depreciation for Dwellings and Other buildings includes the costs associated with the transfer of land and buildings but a breakdown under gross investment or depreciation is not included. The Net Investment under Dwellings and Other Buildings could be larger if conveyancing costs were included in the gross investment figure (as they are in the depreciation figure). It should also be noted that the gross investment figure for Other Buildings and Construction includes land rehabilitation but land is not included in the depreciation figure.
The negative net investment figure for other machinery and equipment is large but a lot of this could be explained by the almost stalling of activity in the construction sector. It be argued that a lot of the machinery and equipment here is out of use rather than depreciating and will never be replaced.
For 2011, it is likely that gross fixed capital investment will struggle to get much over €16 billion (in 2009 prices). It is €12.6 billion for the first three quarter of the year. The 2010 depreciation figure of €16.2 billion is unlikely to the much changed for 2011. An increase in the capital stock for 2011 is unlikely and the prospects are that a similar outcome will occur in 2012.
Finally here’s net investment as a percent of GDP.
Tweet


No comments:
Post a Comment